Using a Daily Maximum for Autoregulation. 

How do you know if your athletes have recovered from a game or a training session, on a per session basis? How do you know if your program is working and they are increasing their performance? Using a daily max is a great method for assessing an athlete's recovery and readiness for performance.


Planning training loads for the gym can be done in a number of ways. Traditionally you would test athletes 1RM (or estimated 1rm) at the end of a cycle, or in a preseason testing session, then prescribe certain percentages from this for the next cycle.

For example; Week 1 4x4 @ 80%

Week 2 4x4 @ 82.5%


And so on…

The problem here can be being flexible with a team sports athlete, who has other training demands outside of the gym. If the athlete has had a heavy contact session or a higher than normal game load, travel, etc these can all throw off recovery, and progression may not be appropriate, or they may not be able to complete what is prescribed.

IMG-9114.jpg


To get around this, you may not even prescribe percentages, and just let the athletes go by “feel” and increase weights from week to week, in a sense this is a form of autoregulation or self-regulation.


The problem with this scenario can be that letting an athlete go by feel can go in 2 directions, you have the guy that loves lifting and will try and set a new PR every session, sometimes to their own detriment. Then there is the other guy who hates lifting and will simply do the minimum or whatever is left on the bar and doesn't really care.


My suggestion to work around both of these scenarios is to use a daily maximal lift, and to use velocity-based training alongside this. It also works well for athletes who crave a bit of intensity and competition.


For example; Monday morning the athletes present for a lower body-based session. After the normal warm-ups, the athlete works up to a very heavy 1 rep maximum on back squats, aiming to keep the speed above 0.35m/s using a velocity (bar speed) measuring device. This speed is around 90-95% of a genuine all-out 1RM for back squats. Once this threshold is reached, the athlete can then begin the “work” sets, using the daily max as a starting point. This initial 1 rep 90-95% 1RM is used as a measuring stick, assessing recovery from the weekend's game, as well as the performance of the athlete.


Warm up: 5x60kg

5x80kg

3x100kg

2x120kg

1x140kg

1x160kg

1x170kg


Working sets:  1x180 @ 0.38m/s

1x185 @ 0.34m/s  (daily maximum reached) 

4x4 @ 80% (145kg)

IMG-9116.PNG


A key point, it's important to note that you would intentionally stop adding weights to the bar even if you feel you could lift more once the speed threshold is reached. keeping some in the tank is vital for the recovery aspect. Keeping the speed consistent week to week is important to gauge how things are moving. So even once the 185kg squat was complete, the athlete may feel good, but as they have passed the speed threshold that's it for the day.


Week to week, the idea is that you see some form of progression when moving through a cycle of training. So you may increase the “work sets” % 's or fluctuate the volume.


Week 1: 1x185 @ 0.34m/s, 4x4 @ 80%

Week 2: 1x187.5 @ 0.36m/s, 4x4 @ 82.5% 

Week 3: 1x182.5 @ 0.35m/s 4x4 @ 85%

Week 4: 1x190 @ 0.34m/s, 4x4 @87.5%


When doing upper body exercise like bench press 0.20m/s may be more appropriate as different lifts have different speeds. We are currently using Gym Aware as a velocity measuring device.


This method could also be used without a velocity measuring device and would require athletes to be able to gauge effort and speed at different loads, which could be very difficult given their experience level.


I appreciate you reading this far, hopefully, you can take something valuable from this.


Improving your work capacity

Progressive overload is pivotal for increasing performance, whether it's increasing the weights, the sets, or the reps - you need to increase the stress to progress over time.


Developing a stronger work capacity in the gym can help lay the foundation of hypertrophy, strength and power to follow. The underlying principle of increasing your work capacity is to allow yourself to tolerate and recover from more work, session to session and week to week. 


Volume, or amount of training, is thought to determine the magnitude of a physical adaptation. The more work you do, the bigger the results you get, quite simple, and applies to more than just lifting weights. Progressing volume, and allowing your body to be conditioned to higher workloads will result in larger responses to training, in whatever direction you are going in.


There are a number of ways to progress from week to week in the gym. Generally speaking, any linear progressive program usually increases the load each week, and possibly decreases the reps. For example Week 1, 4x10 @ 100kg; Week 2, 4x8 @ 110kg. This would be considered an incredibly “normal” approach to strength training.


While intensity does go up, the total workload decreases, thus potentially decreasing total volume and also your work capacity. Instead of this typical approach, what I’m suggesting is maintaining or very gradually increasing intensity, while challenging yourself through volume and your ability to tolerate it. While also challenging your recovery ability through setting a time limit. Setting a time limit on the work you’re doing is important as simply increasing sets week to week will not guarantee that you are improving, just staying in the gym longer and putting up with more.


Work Capacity Training Examples


Here is an example of what I'm talking about, set a timer for a set amount of time, say 30 mins for this example. Select 2 exercises that are agonist / antagonist like a push and pull, OR If this is used for the lower body then potentially 1 exercise may be enough such as front squats. Go as hard as you can, and get as many sets as possible in the time frame, hitting your target reps each time. Record your results.


Time: 30 mins Weight Reps Total Sets?

A1: Incline DB Press 40kg 10 5

A2: Chin Ups BW+5kg 6 5


Lets say, for example, the target number of sets was 5, in the example above the athlete has achieved 5 total sets of both exercises in 30 mins - great! However as he has not surpassed this, with 6 or more sets, then he has to keep the same weight for next session and try again. Once the athlete can achieve 6+sets in the time frame, then the load can be increased, usually by around 2.5%, or whatever gym maths makes sense.


If the athlete was to only achieve 4 or less sets, then they would have to reduce the load by around 2.5% and try again again next session.


By no means are these strict rules, just general guidelines. You may want to increase the time frame to 45 mins, and use something like 10 sets of 4 as a target. Or possibly decrease the time frame to 10 minutes and try to achieve 4 sets of 12 for some accessory work. These are just some other examples that may work, depending on the goals.


After completing a work capacity block of 4-8 weeks, you should hopefully be able to tolerate a higher workload, in a shorter period of time. From here, moving to a more traditional intensity increasing program, or an intensification phase will reap the rewards of your previous block of training.


Using GPS in Professional Rugby: Load Monitoring and Performance.


Recently I was invited to present at the Tokyo World series sports tech conference to discuss the use of GPS in rugby and in particular how my team uses GPS for load monitoring and performance. I hope to share some of that information with you here.

There are several ways in that GPS can be used with field sport athletes, and particularly in Rugby Union. In this post, I would like to explain how we at the Kintetsu Liners use GPS on a daily, weekly, monthly and yearly basis to increase performance and reduce injuries.

IMG_5750.jpg

To begin with, what am I talking about when I say GPS? 

We use a Catapult GPS and the corresponding software, Openfield. We currently use devices that measure at 10 Hz. It is a little black device that sits on in between your shoulder blades. Players wear these devices for every training session and game. 


So, what do we measure and why?

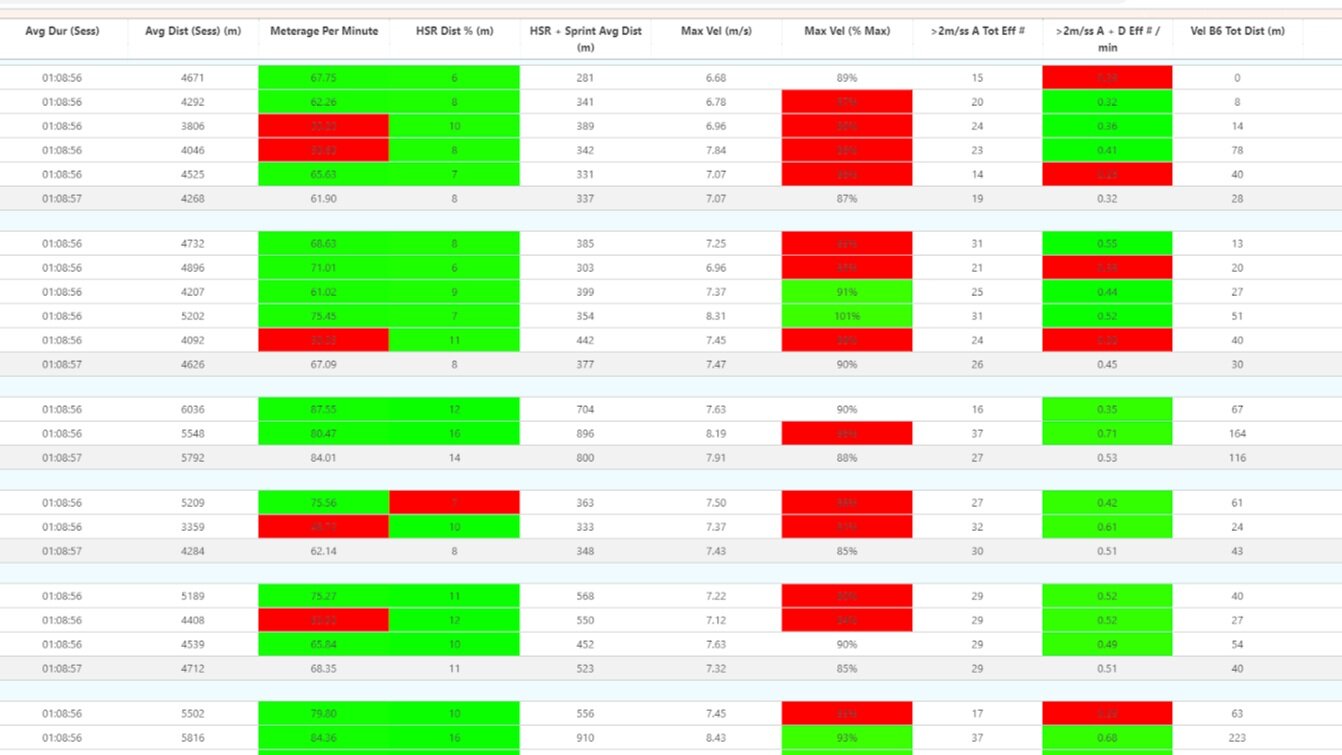
Below is a typical day of training for us, and there are a few columns of selected variables. Whilst there are hundreds, if not thousands of different variables we can measure, these are the handful I currently find useful for my team. The reason for the red and green formatting is to see if the players have specific targets we have set for them - usually being based around game intensity and positional demands.

Daily+Table+1.jpg

Total time or session duration: Fairly obvious and easy to track. Just measured in hours and minutes.

Total distance: Again, one of the easiest things to monitor and track over the long term in total distance measured in meters.

Meters per min: This can be thought of as average speed per minute of the game/training. This gives an indication of how fast a game or training session was.

High-speed running and HSR %: We count high speed running as anything over 5m/s and then that’s represented as a % of total running. Generally speaking, if you are traveling at 5m/s you are running. Anything below this would be considered walking or jogging. Very roughly we aim for 10% of our running to be high-speed in training sessions and games. (Although it fluctuates a lot depending on the player, their position and the type of training we are doing) This % would vary greatly for different sports.

IMG_5748.jpg

Max Velocity and % of Top Speed: Everyone wants to run fast right!? This is how we measure this. What was the top speed you hit in training or the game? It only needs to be for a split second to count. Again, it’s measured in meters per second, although some measure it is in kilometers per hour. Ideally, we want our players to hit at least 90% of their top speed twice a week. Their 100% is taken from a speed test, or their top score ever on the GPS.

Acceleration efforts, and efforts per minute: There are several different ways of measuring accelerations. We use 2m/s/s. This means that if you increase your speed by 2m/s within 1 second this will count as 1 acceleration effort. For example, if you are jogging along at 3m/s and then accelerate to 5m/s, this would count as 1 acceleration effort. It is important to look at acceleration effort as 2 players may have run the same distance, yet one player may have doubled the other’s acceleration efforts meaning that they are training harder.

Efforts per minute are just an extension of this. How many efforts you have done relative to the time?

Vel B6 (Sprint meters): This is the total distance you have covered over 6.6m/s, which is generally considered sprinting speed and over.

Now we have a shortlist of the variables taken care of, we can look at how we might set up a daily training session and view it. I usually do this from a volume and intensity point of view.

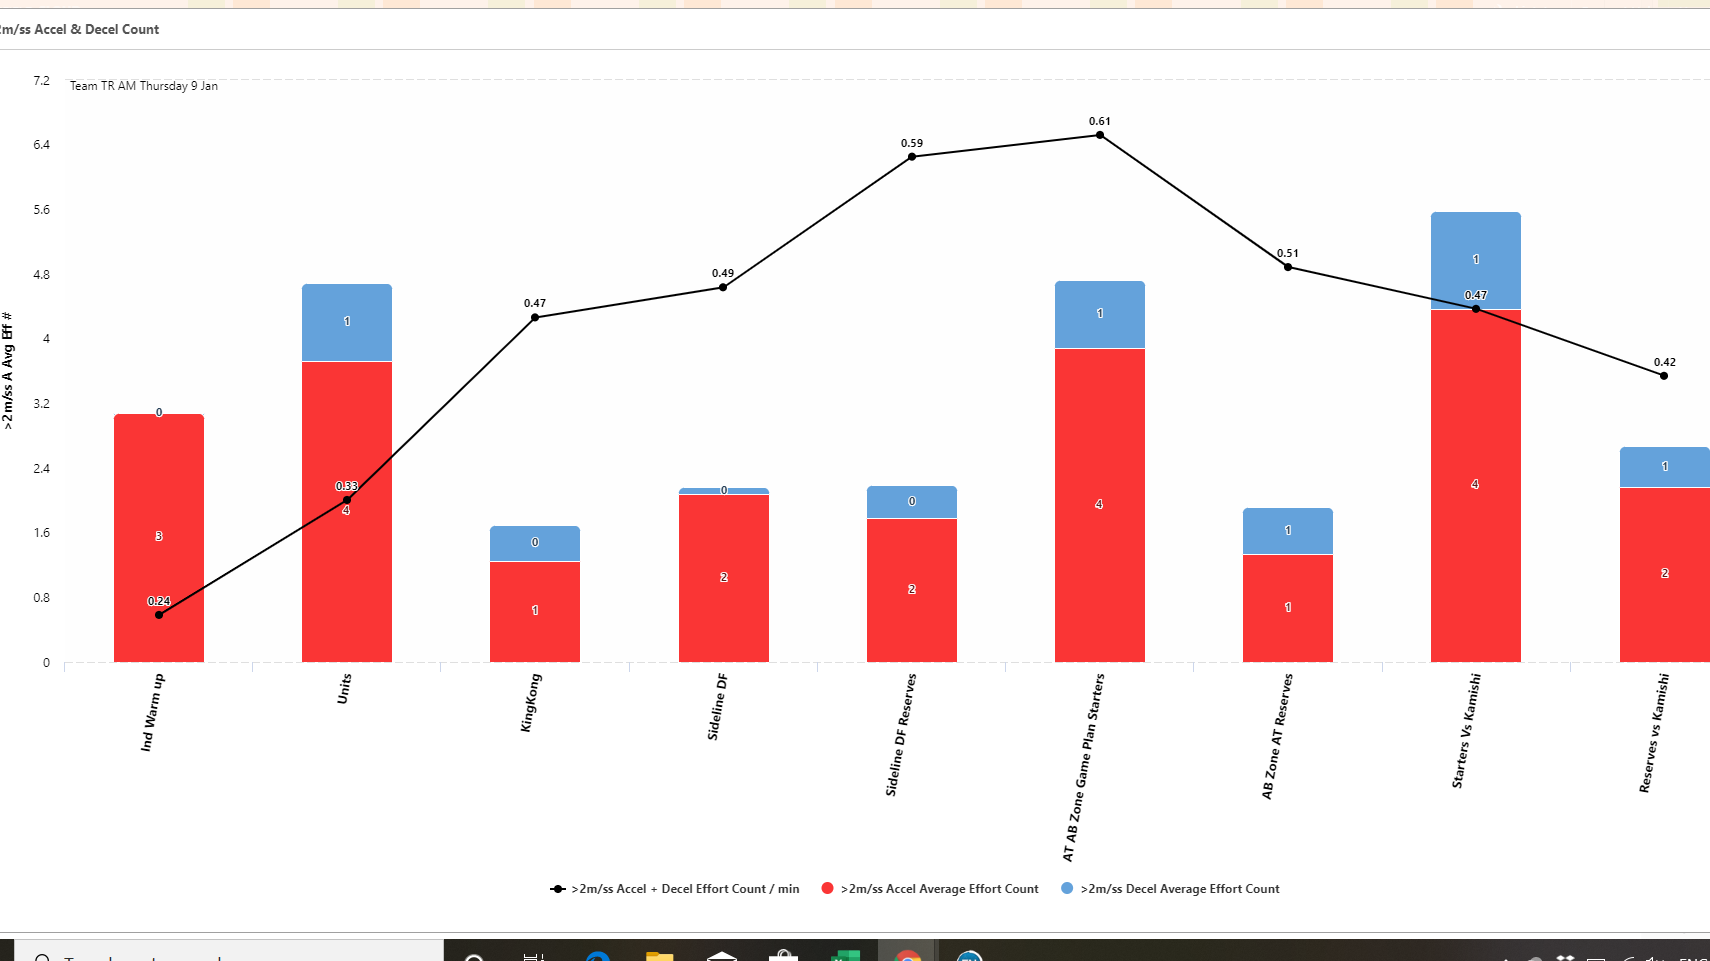
Below are the first two graphs I would look at to see the differences in speeds ( M/min), volume and HSR through a daily training session, as well as accelerations and decelerations in red and blue. Its great feedback to be able to give to coaches around how fast or intense certain drills were and if they met the demands or targets we have set.

2020-01-13 (1).png
2020-01-13 (3).png


My first view of this training session was that it was done with high m/min maintained over the session, as well as keeping the intensity high in regards to acceleration volume. The total volume was not overly high as it was our last training session before a game.

It’s important to note that some sessions may not be done at high speed or high intensity. For example, certain players may be working on certain skills that don’t require high amounts of running or accelerating. 

This can be seen when we look at a weekly view of training, Below

2020-01-13 (4).png

This is the same acceleration graph as above, but instead of looking at the differences between components of training, looking at how the days fluctuate from day-day.

Its also interesting to note that the 5th day is game day, and from an acceleration standpoint, we have been training harder on average than we play. Which is great to visualize and something we strive for in training.

We can also see below the fluctuations in volume from day to day, and how we front-load the week with the majority of our volume.

Weekly+volume+2.jpg

Now we have these points as references, how do you go about using this information to increase performance?

Well, to begin with, I touched on it earlier, but you have a clear line in the sand when it comes to what a game “costs” you from a physical standpoint. As we know this you can then make sure that training is meeting these demands. If the game is played at 70 m a minute you can make components of training at 70 m a minute or above. In fact, the demands of a rugby game are more likely to be 140 m a minute. This is important to note the peak demands of the game and look closely at GPS to make sure training is appropriate. This information can be communicated with the coaches when it comes to planning and periodizing training.

Another aspect of increasing performance over time is to monitor these variables such as high-speed running or accelerations and look to increase them to ensure players are getting fitter and playing rugby at a higher speed. You can look closely at individual players or at certain components of training and make sure that speed has increased or a certain player is now working harder. This information can be fed back to the player and discussed. For example, let’s say a certain defensive line-speed drill has been done in week 1 of the preseason, you can pull up this data and compare it to week 4 and look on a team average to see if the team is moving in the right direction and getting off the line harder in defense. You may also pull up an individual player and discuss his results compared with other players in the same position. This is where the formatting in the table becomes helpful, as players can compare with each other and also see if they are hitting their benchmarks.

Below I have a graph showing our annual running volume and how it fluctuates from week to week and month to month. It’s interesting to see that two weeks are never the same much the volume can fluctuate over the course of the season. This leads to a discussion around load monitoring of players in the team.

chart.png

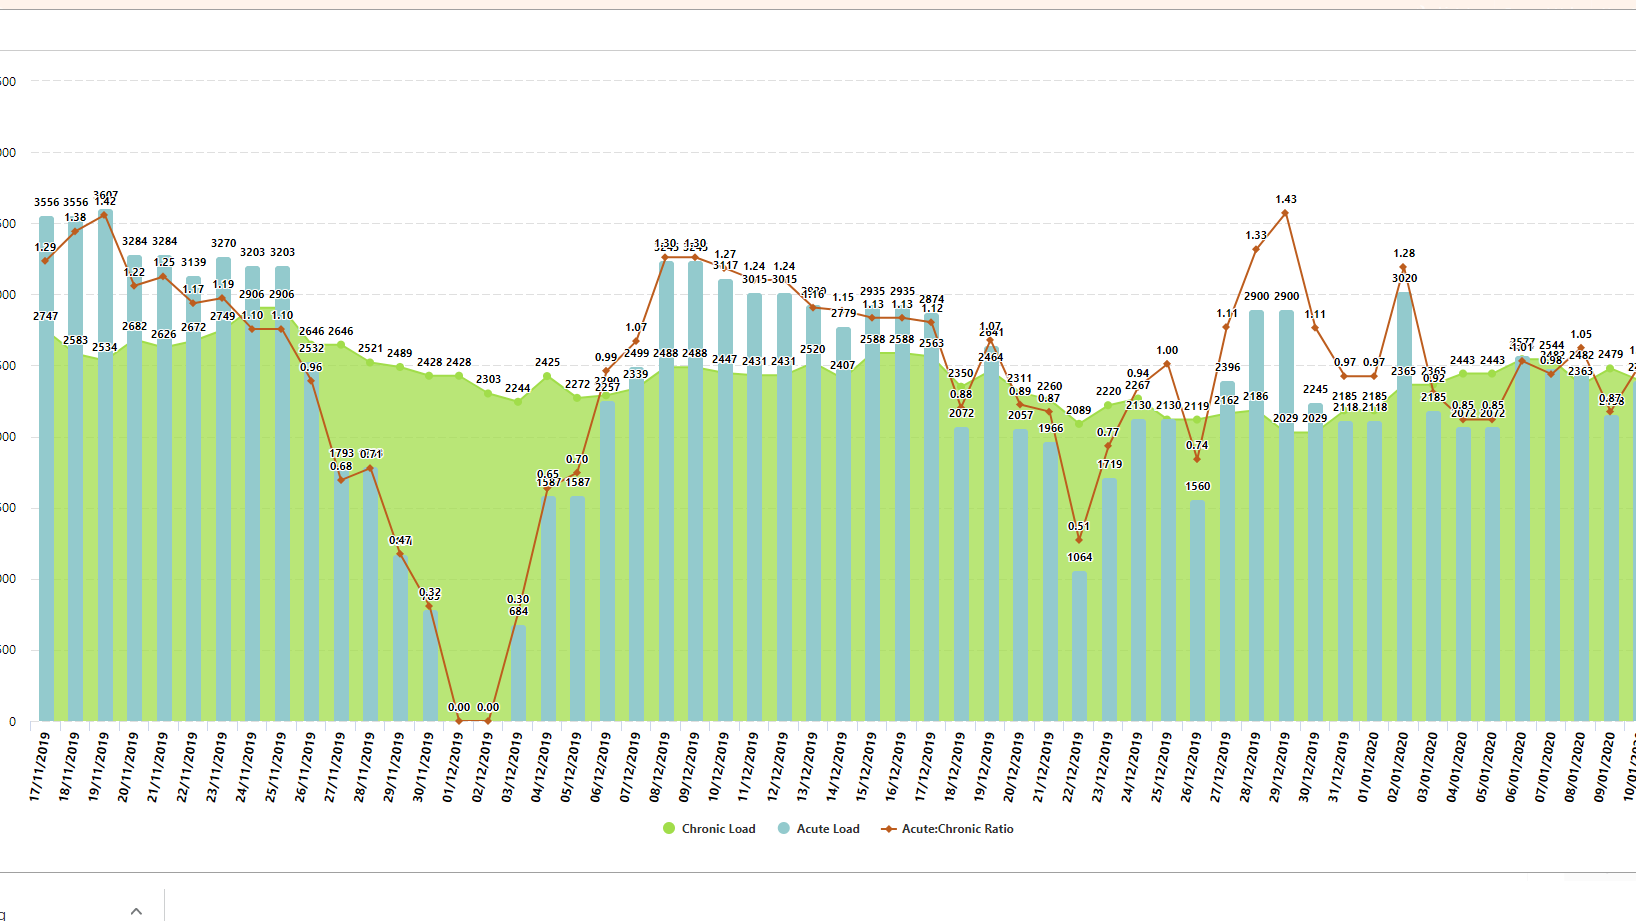
One of the best ways to do this is to use the acute chronic ratio which has been popular in the last few years and there is plenty of literature surrounding this available to you online. I won’t go into too much detail here about that because there is so much quality information available to you… however, very basically take your average workload over the last 4 weeks or so, and compare it to what you have done this week.

Below is a graph showing how we monitor individuals with the acute to chronic ratio.

2020-01-13 (7).png

Whilst there are a number of variables you can use for the acute chronic ratio, I mainly use high-speed running as I feel this is most relevant to our athletes. You can see that this graph fluctuates significantly (similar to the annual volume) and you can see that there are periods where the ratio drops quite low and then spikes back up. This is usually seen after weeks off from training or holidays. Ideally, you want to avoid these big spikes as much as possible and use this information to correctly load manage players backing to full training. I do put a high emphasis on objective data like this however; it’s also important to take in subjective data such as fatigue and soreness levels.

Thank you for taking the time to read this short blog post. I hope to do more posts soon on other aspects of GPS.

Podcast With Nevin Mills of The Strength Institute of Western Australia

Recently during the off-season from my current role in Japan I was back in Perth with family and friends. I had the pleasure of stopping in and seeing Nevin Mills and his amazing gym The Strength Institute. He invited me to be a guest on his new podcast, to talk all this Rugby Union Strength and Conditioning. It was a great experience and definitely worth a listen, and if you’re in Perth stop by and check out his state of the art facility!

See more of him here https://www.thestrengthinstitute.com/

Links to download and listen below, available through all the usual places.

https://itunes.apple.com/au/podcast/podcast-1-strength-conditioning-for-rugby-union/id1456347513?i=1000431812222&mt=2&download=true

Building a Better Neck

Neck strength is pivotal for the front row in rugby union and has been closely associated with concussion risk and prevention in contact sports.

I have listed below a few examples of neck exercises that you can perform with a partner. It’s not the be all and end all, but throwing some of these exercises in the mix is a great way to add variety to your strength program. I have commonly used these with all forwards; particularly with the front row, as they can utilise their heads as a weapon in the scrum.

It is incredibly important to note that you want to be extremely careful to begin with when introducing these exercises. Start slowly and build up once a tolerance to intensity has been established.

All three exercises has the athlete set up on a hyper-extension bench. For the first exercise, we are engaging the whole posterior chain. The coach (or partner) pushes down on the back of the head. The athlete uses their neck extensors to isometrically contract and hold in the correct position. Below is a video demonstration of exercise 1.

The second exercise (below) is slightly more aggressive in order to try and best prepare the athlete for the challenges ahead, no pun intended.

To complete this exercise; set the athlete up on the hyper-extension bench just like before. Now grab their head and try and wrestle it from their body, as shown below. I keep the movements multi-directional and random to try and achieve maximal contractions in the flexors and extensors. Forward, backwards, side to side, twisting… it’s all play on!

The third exercise (below) involves lateral movement from the athlete. Simply stand next to them and let them push as hard as they can laterally into your hips. The aim is to try to push you over. It goes without saying; but make sure to train both sides of the neck. This is a relatively simple exercise.

That;s it! 3 simple exercises that can be done with a partner or a coach to help build neck strength and robustness!

Building Size and Strength In Rugby Union Athletes

There are many aspects to developing a Rugby Union player. When I initially profile and screen a new player, the first thing I ask myself is - are they the right size for the job? It's quite common that the answer is ‘no’, particularly working with younger players or Japanese players. The second question I ask is - are they strong enough to do the job?

Mikey Trytime.jpg


I have had great success building hypertrophy and strength using some simple methods which I will share with you now. In the last few years I have had first and second year players commonly gain upwards of 7-11kg in 9 months of training.


I call this a Modified APRE method which is a polite way of saying I have butchered some other programs to come up with this. The APRE method has been around for years and not something I invented, you can read more about it here https://www.ncbi.nlm.nih.gov/pubmed/20543732


Semisi.jpg

The program is always based around progressive overload, but simultaneously involving autoregulation, meaning the athlete will progress at his or her own rate. Within a group or team, different athletes will always progress at different speeds and a program like this will allow for that. It's also great if on field training stress is high because it will allow the athlete to not have to kill themselves in the gym.


The first and third 4 week blocks are accumulation focused meaning the main stress will be through higher volume. On your first week you will do 3 sets of 6 at 70% then a 4th set of as many reps as possible. If you achieve more than 8 reps you would increase the next weeks weight to 72.5% for 4 sets, if you achieve less that 8 reps - you would keep the same load at 70% and try again.


During the second and forth block the intensity will be the main stressor. You will start with 5 reps @ 75% and do many sets of of 5 as possible, if you achieve more than 5 sets, increase the load by 4% (79%) and drop a rep ( 4 reps) for the following session. You follow the same pattern.


It's worth noting when designing any strength training program I always find it very valuable to start low and cautiously add volume and intensity. Much like cooking a steak, you can always cook it more, but cant “uncook” what you’ve already done.


Strength and size for any athlete is important but it's not the whole picture. These programs don't involve any plyometrics, speed or conditioning work - or even a warm up! It's just one aspect.


Simply click the link below for my Modified APRE program. (on mobile devices open in chrome) -  I would love to hear your thoughts on it!


Thanks for reading and happy lifitng! 


Lower Body Profiling and Increases in Speed, Power and Strength

IMG_0358.JPEG

If you are following on from my previous blog post, you would know that I have correlated data for many different exercises in the gym and how they relate to sprinting. I have concluded that there are many different strength qualities that relate to speed, and there is not one defining test that will accurately predict a persons speed.


Now that I am aware of the correlation between different exercises and the expression of speed I can go about creating individualised programs based on the athlete's profile to help them get faster! My area of interest lately has been to train the athlete in what they are lacking - or better their weak points. My theory when designing programs has been to ‘fill in the gaps’ and overcome any obvious weak points. So far I have had great improvements in my athletes’ in their respective weaknesses  which has translated to personal bests across the board.


IMG_0361.JPEG

For example, as seen below both of these athletes have drastically different profiles and it is my belief that they should therefore have different training programs. Player A tested to be very powerful, and moderately fast, however lacked maximal strength, so I have been programming him to increase strength in the lower body. Player B tested to be very strong (2.7xBW squat) and moderately fast, but lacked being able to translate his strength into speed and power (shown by his low RSI and average VJ), so his program focused on producing force and included more jumping and plyometric movements.


Before.jpg


Here is an example of how I would differentiate the programs to highlight and improve on their weak areas while maintaining and improving their strengths.

FullSizeRender.jpg

Both programs are similar yet with obvious differences. Both contain strength work for the lower body however; different volumes, intensities and exercises are used to stress the system that needs the most work.

After profiling my athletes early in the year, most of the 8 week preseason was spent training on individualised programs similar to the one above. Here is a realistic improvement seen over the course of a preseason with actual players. It is interesting to see how their profiles moved around after specifically training a weakness.

After.jpg
Stats.jpg


I have found this type of profiling and then programming from it to be very effective to say the least. 49 out of 50 players increased performance in the 10m and 20m tests which I count as a win! 

Lower Body Exercises and Carry Over to Speed and Acceleration

mikey try.jpg

In field sports, speed is an athletic quality that has direct impact on the game. While having a big bench press is great - it's unlikely to affect the score line, however outright pace can beat defenders, break the line, and score in the corner. Whilst training for maximum strength is important, as the saying goes, “speed kills”.


Recently, in an effort to increase transfer from the gym to the field I have been looking into the lower body profiling of my athletes and what exercises or strength qualities correlate strongly with speed. The exercises I have chosen to evaluate the lower body performance of my team have been as follows:

inami step.jpg
  1. RSI (reactive strength index) or drop jump test

  2. Vertical Jump

  3. BB Back Squat 1RM ( relative to body weight)

  4. Broad Jump

  5. 10 and 20 meter time


Why these exercises? I have chosen these exercises for a number of reasons. Most of them are very simple and easy to do and they also test a variety of different strength and power qualities.

Vertical jump and broad jump are very similar exercises. However, the broad jump is in a horizontal plane and vertical jump is, well, vertical. You are testing your body’s ability to produce force through your lower body into the ground relative to your own body weight.

The RSI (or drop jump) is a reactive strength test. It tests the Athletes ability to absorb eccentric load and quickly turn that into concentric force. I have touched on this exercise previously in my first blog.

The 1RM Barbell Back Squat is quite straight forward - you are testing the maximum strength of your lower body. I always make sure my athletes are getting their hips below their knees.

How do I test these? I add them into the program for the day or week when I am not running a separate program for testing. Generally on a typical Thursday (G-3 with a Saturday game) I will treat it as a spark up day. This means a lighter, faster day before a game in an effort not to be too taxing, using heavy loads and to get the athlete thinking of moving fast.

Example program for a G-3
A1: Hang Power Snatch 4x3 @ 70%
A2: RSI drop Jump test 3x3

Generally speaking the lower body testing exercises are super-setted with a fast Olympic lifting variant. This is sometimes referred to as contrast loading.

However, the Back Squat 1RM is usually only taken once every few months during a planned test. This would take place wherever it seems logical to fit into a busy team schedule. Generally speaking this is not in season or around games. We usually have a program that progressively builds up to the test, so it is not too much of shock. The athletes are always made aware of the testing ahead of time.

Once I have collected these scores, I can begin to compare them with their speed times, of 10m and 20m. I do this with a Pearson's R correlation to get a value of correlation.  A quick refresher; The closer the value is to 1 or -1 the higher the correlation, the closer it is to 0 the weaker the correlation.

Speed Correlations.jpg

As you can see in the table above all of the exercises have somewhat of a correlation with different aspects of speed. The main point I personally take from this information is that all the different tests somewhat carry over to speed. However, not one single test/exercise is the answer, and many different qualities are needed. This also highlights the need for running/sprinting based training as simply just hitting the gym wont get you fast.

The highest correlations come from Vertical Jump and Broad Jump, not surprisingly. It is interesting that different exercises have different correlations with different aspects of speed, such as the first 10 vs a rolling 10-20 meter.

I also found it incredibly interesting that the back squat had such a low correlation to 10 meter time, which may go against some current literature. This data is only reflective of the playing group I currently train though, and not representative of other types of athletes.

10-20m vs VJ.png


My next blog post will continue down this path and look at weaknesses in individuals.

Is how you feel a lie? Performance vs Subjective fatigue.

One of the Front Rowers demonstrating the RSI test that is performed weekly on the jump mat.

One of the Front Rowers demonstrating the RSI test that is performed weekly on the jump mat.

Monitoring and managing fatigue is an important part of running the physical conditioning for a team sport, as well as helping to prevent injuries through making sure recovery is optimised, having a team fresh or fatigued for game day may also impact the final score line. There are currently many methods available to do this, such as; RPE, HRV, GPS etc. The majority of which I have had some experience with or use currently.


I have been wanting to improve the way I monitor and manage my teams in-season fatigue and be able to compare it to other factors such as training load or physical performance. I initially set out to determine if I could predict fatigue/freshness through using a performance based test. I chose to use an RSI or reactive drop jump test. This is an area I have been interested for some time as I have many discussions with different colleagues about it, and have often heard of it being implemented in different settings.


I chose to use this test as it is very simple and easy to do, just pull the jump mat out and away you go. It doesn’t require a large amount of effort from the athletes and should not add to the accumulation of fatigue.


My hypothesis was that if a player performs poorly in the test (<90% of his best) then he would be fatigued and not be performing on the field. I the player is  performing well in the test then they would be performing well on the field.


This was only my hypothesis, so I didn’t let the results reflect training load or intensity, and the boys played and trained as normal, I just collected data in the background.


Simultaneously I collected GPS data, RPE data, as well as subjective player data about lower body soreness and general fatigue. This was collected using ‘One Tap Conditioning’ an Athlete Management System (AMS) here in Japan. These scores were taken on the same day as the RSI test, which was consistently a regular “Thursday” or G-3.


Upon review of the data I found my hypothesis to be completely incorrect. I found no correlation between training load (GPS or RPE) and performance on the jump test. Meaning that the athletes may jump high when training load was high and visa versa. This rings true for all data I collected, nothing seemed To correlate with performance in the test.


The most interesting conclusion that I came to was that there was actually positive relationship between lower body soreness and jump performance. Meaning that the more sore players were, there better they performed. Just let that sink in for a minute, the worse they reported feeling, the better they performed.


So why is this?


While I’m still working on that one, one possibility is that the harder you train, the better you perform, however your soreness and fatigue increases with the increased training load.  


While it is only a weak relationship, I did have a large playing group of 50 athletes to work with, all of whom participated in the research. Have a look at the correlation above, and please leave a comment!

RSI vs Lower.jpg