Recently I was invited to present at the Tokyo World series sports tech conference to discuss the use of GPS in rugby and in particular how my team uses GPS for load monitoring and performance. I hope to share some of that information with you here.
There are several ways in that GPS can be used with field sport athletes, and particularly in Rugby Union. In this post, I would like to explain how we at the Kintetsu Liners use GPS on a daily, weekly, monthly and yearly basis to increase performance and reduce injuries.
To begin with, what am I talking about when I say GPS?
We use a Catapult GPS and the corresponding software, Openfield. We currently use devices that measure at 10 Hz. It is a little black device that sits on in between your shoulder blades. Players wear these devices for every training session and game.
So, what do we measure and why?
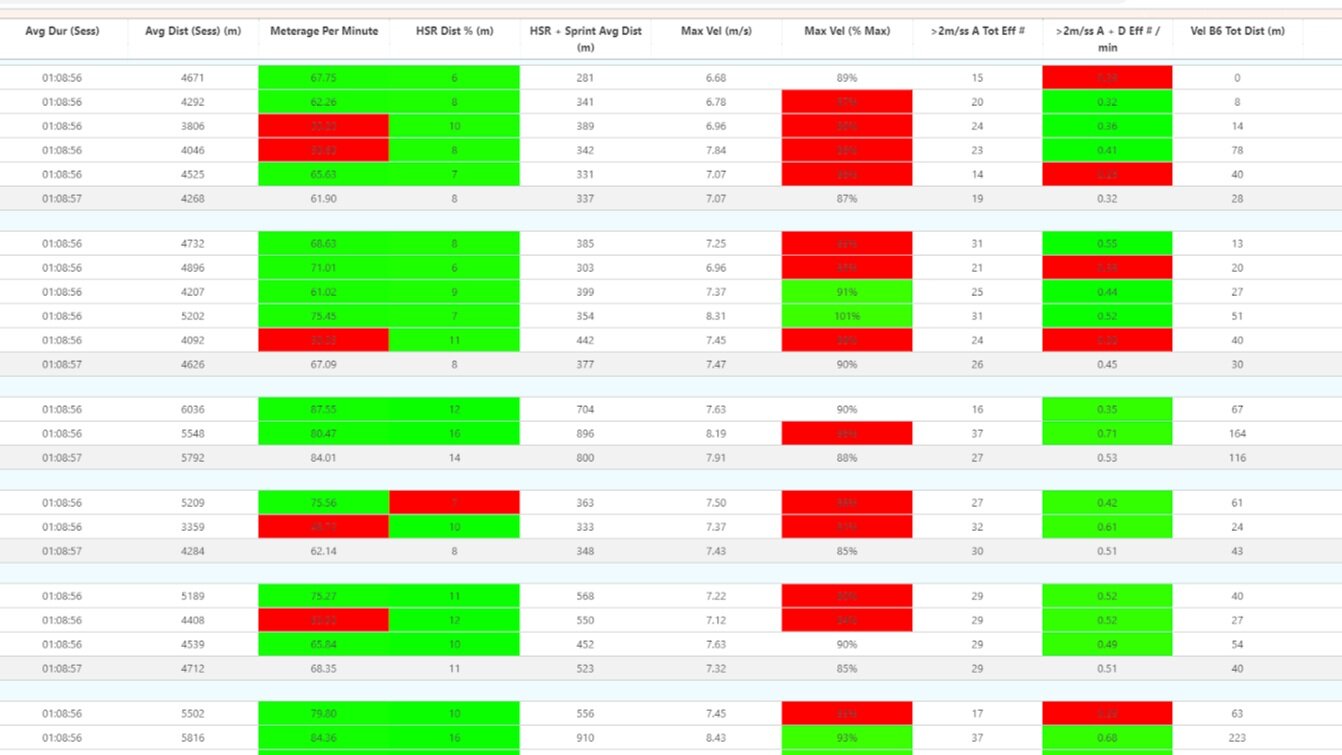
Below is a typical day of training for us, and there are a few columns of selected variables. Whilst there are hundreds, if not thousands of different variables we can measure, these are the handful I currently find useful for my team. The reason for the red and green formatting is to see if the players have specific targets we have set for them - usually being based around game intensity and positional demands.
Total time or session duration: Fairly obvious and easy to track. Just measured in hours and minutes.
Total distance: Again, one of the easiest things to monitor and track over the long term in total distance measured in meters.
Meters per min: This can be thought of as average speed per minute of the game/training. This gives an indication of how fast a game or training session was.
High-speed running and HSR %: We count high speed running as anything over 5m/s and then that’s represented as a % of total running. Generally speaking, if you are traveling at 5m/s you are running. Anything below this would be considered walking or jogging. Very roughly we aim for 10% of our running to be high-speed in training sessions and games. (Although it fluctuates a lot depending on the player, their position and the type of training we are doing) This % would vary greatly for different sports.
Max Velocity and % of Top Speed: Everyone wants to run fast right!? This is how we measure this. What was the top speed you hit in training or the game? It only needs to be for a split second to count. Again, it’s measured in meters per second, although some measure it is in kilometers per hour. Ideally, we want our players to hit at least 90% of their top speed twice a week. Their 100% is taken from a speed test, or their top score ever on the GPS.
Acceleration efforts, and efforts per minute: There are several different ways of measuring accelerations. We use 2m/s/s. This means that if you increase your speed by 2m/s within 1 second this will count as 1 acceleration effort. For example, if you are jogging along at 3m/s and then accelerate to 5m/s, this would count as 1 acceleration effort. It is important to look at acceleration effort as 2 players may have run the same distance, yet one player may have doubled the other’s acceleration efforts meaning that they are training harder.
Efforts per minute are just an extension of this. How many efforts you have done relative to the time?
Vel B6 (Sprint meters): This is the total distance you have covered over 6.6m/s, which is generally considered sprinting speed and over.
Now we have a shortlist of the variables taken care of, we can look at how we might set up a daily training session and view it. I usually do this from a volume and intensity point of view.
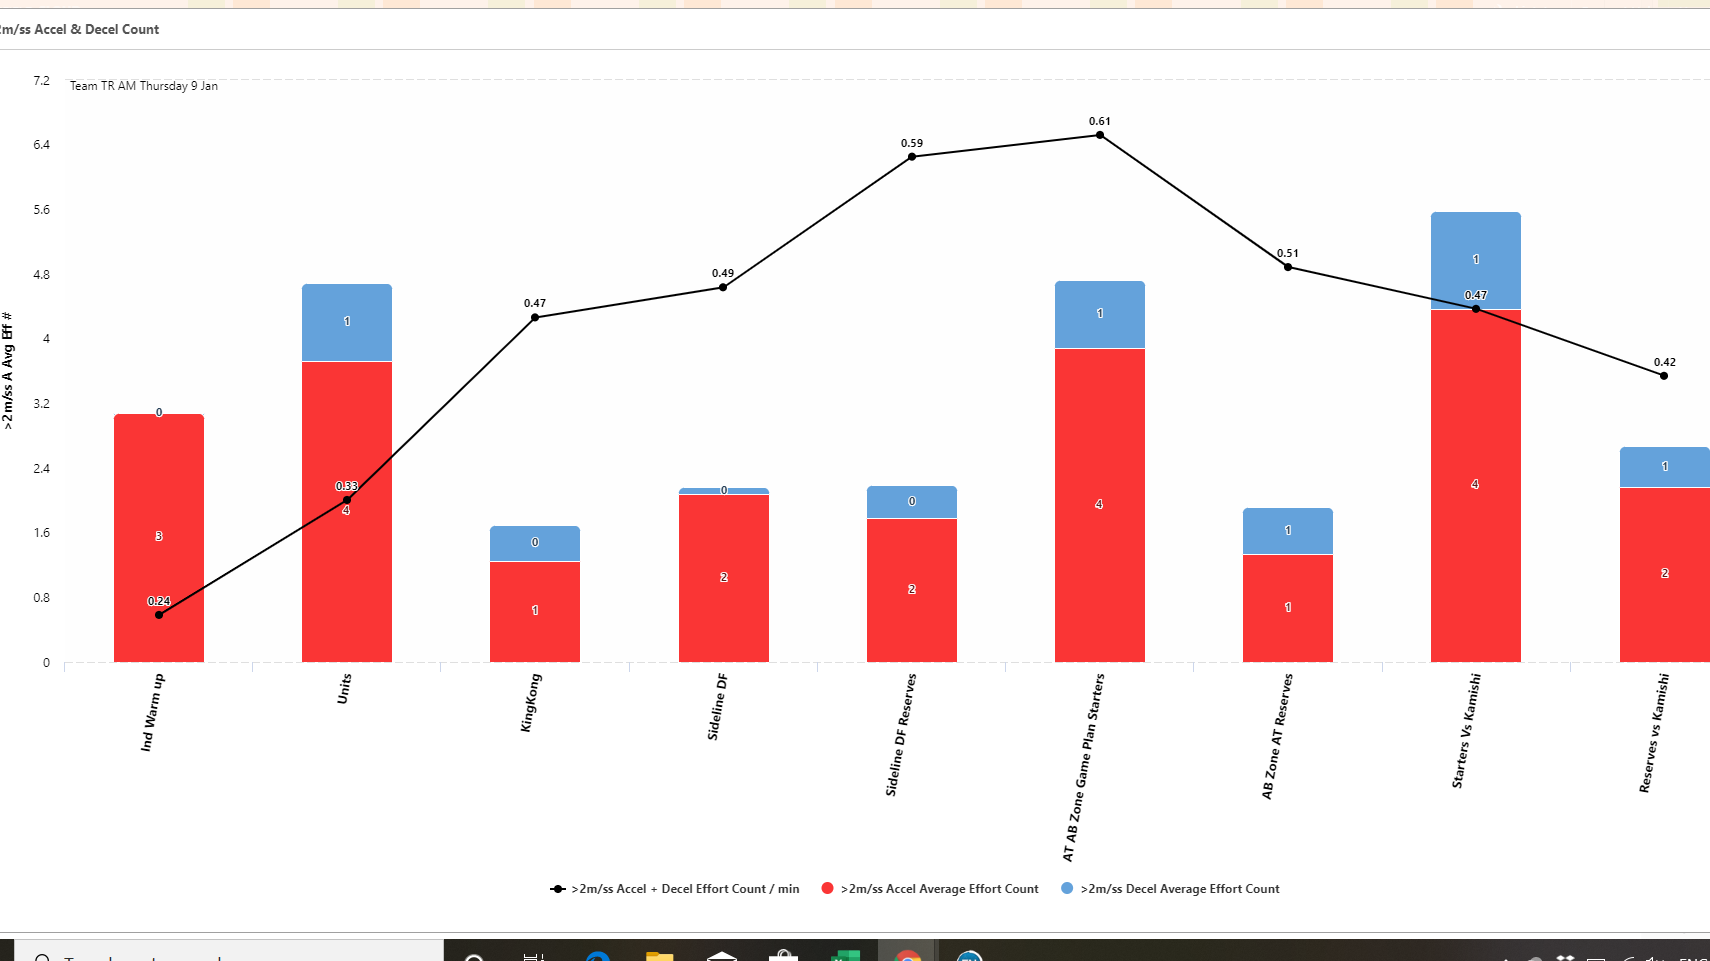
Below are the first two graphs I would look at to see the differences in speeds ( M/min), volume and HSR through a daily training session, as well as accelerations and decelerations in red and blue. Its great feedback to be able to give to coaches around how fast or intense certain drills were and if they met the demands or targets we have set.
My first view of this training session was that it was done with high m/min maintained over the session, as well as keeping the intensity high in regards to acceleration volume. The total volume was not overly high as it was our last training session before a game.
It’s important to note that some sessions may not be done at high speed or high intensity. For example, certain players may be working on certain skills that don’t require high amounts of running or accelerating.
This can be seen when we look at a weekly view of training, Below
This is the same acceleration graph as above, but instead of looking at the differences between components of training, looking at how the days fluctuate from day-day.
Its also interesting to note that the 5th day is game day, and from an acceleration standpoint, we have been training harder on average than we play. Which is great to visualize and something we strive for in training.
We can also see below the fluctuations in volume from day to day, and how we front-load the week with the majority of our volume.
Now we have these points as references, how do you go about using this information to increase performance?
Well, to begin with, I touched on it earlier, but you have a clear line in the sand when it comes to what a game “costs” you from a physical standpoint. As we know this you can then make sure that training is meeting these demands. If the game is played at 70 m a minute you can make components of training at 70 m a minute or above. In fact, the demands of a rugby game are more likely to be 140 m a minute. This is important to note the peak demands of the game and look closely at GPS to make sure training is appropriate. This information can be communicated with the coaches when it comes to planning and periodizing training.
Another aspect of increasing performance over time is to monitor these variables such as high-speed running or accelerations and look to increase them to ensure players are getting fitter and playing rugby at a higher speed. You can look closely at individual players or at certain components of training and make sure that speed has increased or a certain player is now working harder. This information can be fed back to the player and discussed. For example, let’s say a certain defensive line-speed drill has been done in week 1 of the preseason, you can pull up this data and compare it to week 4 and look on a team average to see if the team is moving in the right direction and getting off the line harder in defense. You may also pull up an individual player and discuss his results compared with other players in the same position. This is where the formatting in the table becomes helpful, as players can compare with each other and also see if they are hitting their benchmarks.
Below I have a graph showing our annual running volume and how it fluctuates from week to week and month to month. It’s interesting to see that two weeks are never the same much the volume can fluctuate over the course of the season. This leads to a discussion around load monitoring of players in the team.
One of the best ways to do this is to use the acute chronic ratio which has been popular in the last few years and there is plenty of literature surrounding this available to you online. I won’t go into too much detail here about that because there is so much quality information available to you… however, very basically take your average workload over the last 4 weeks or so, and compare it to what you have done this week.
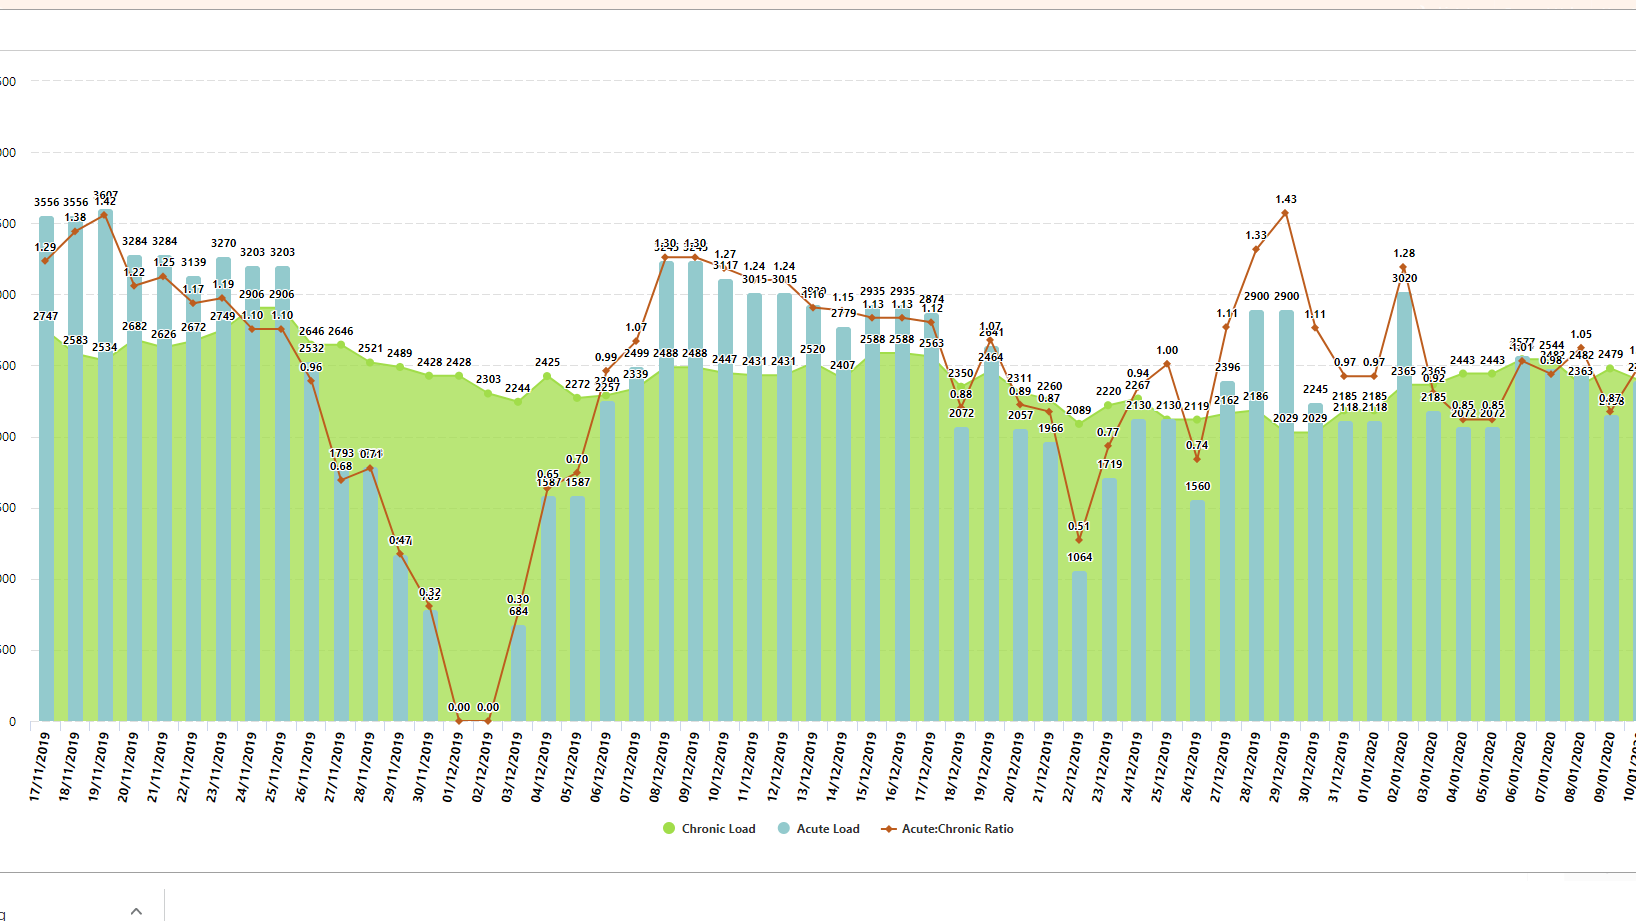
Below is a graph showing how we monitor individuals with the acute to chronic ratio.
Whilst there are a number of variables you can use for the acute chronic ratio, I mainly use high-speed running as I feel this is most relevant to our athletes. You can see that this graph fluctuates significantly (similar to the annual volume) and you can see that there are periods where the ratio drops quite low and then spikes back up. This is usually seen after weeks off from training or holidays. Ideally, you want to avoid these big spikes as much as possible and use this information to correctly load manage players backing to full training. I do put a high emphasis on objective data like this however; it’s also important to take in subjective data such as fatigue and soreness levels.
Thank you for taking the time to read this short blog post. I hope to do more posts soon on other aspects of GPS.


